Voter Flows Between Two Parliamentary Elections in Finland
nnls
flow analysis
ggplot2
visualizations
election data
election statistics
This article analyzes voter flows using non-negative least squares and only election data on the example of the latest parliamentary elections in Finland.
Introduction
It is interesting to observe how the electorate flows from one party to another in subsequent elections. Sometimes, good flow visualizations, also known as alluvial diagrams or flow charts, that show the flows of the electorate can appear in mass media. However, for some visualizations, we need data from sociological surveys that contain questions about old and new choices. Usually, some surveys provide only questions about current electoral sympathies. After elections, we often wonder who voted for a certain party, but analysis can show that they are people who previously voted for much better candidates and parties. However, the good news is that we can estimate voter flows without using sociological data. We only need election data aggregated to polling station level, which helps us model all voter flows between elections given that the borders of polling stations did not change.
Methodology
The methodology of such analysis is described in more detail in one of my previous pieces. It is assumed that the same people usually vote at the same polling station. Therefore, if party X won at polling station 1 in the previous election, but party Y won in the next election, it means that the people who vote at this station changed their sympathy from party X to party Y. In short, the latest polling station result of every party is modeled through a regression model in which independent variables are the results of all parties in the previous elections. The non-negative least squares method is used to build the model in which the predicted result of the party is a simple sum of the results of all parties in the previous election multiplied by a defined coefficient. Such an approach helps define the flows of voters.
Parliamentary election in Finland 2023
Finland is a good object of such voter flow analysis due to several reasons: stable and active participation in elections (more than 70% turnout); stable political system (the same most popular parties); and stable electoral district division. There were some changes in comparison to 2019, but in general, the list of polling stations is 90% the same, enabling polling station-level analysis. Demographic changes in Finland are also not significant, although it makes some effect. That means most of the votes are given by the same people in the same location.
Voters flow in Finland
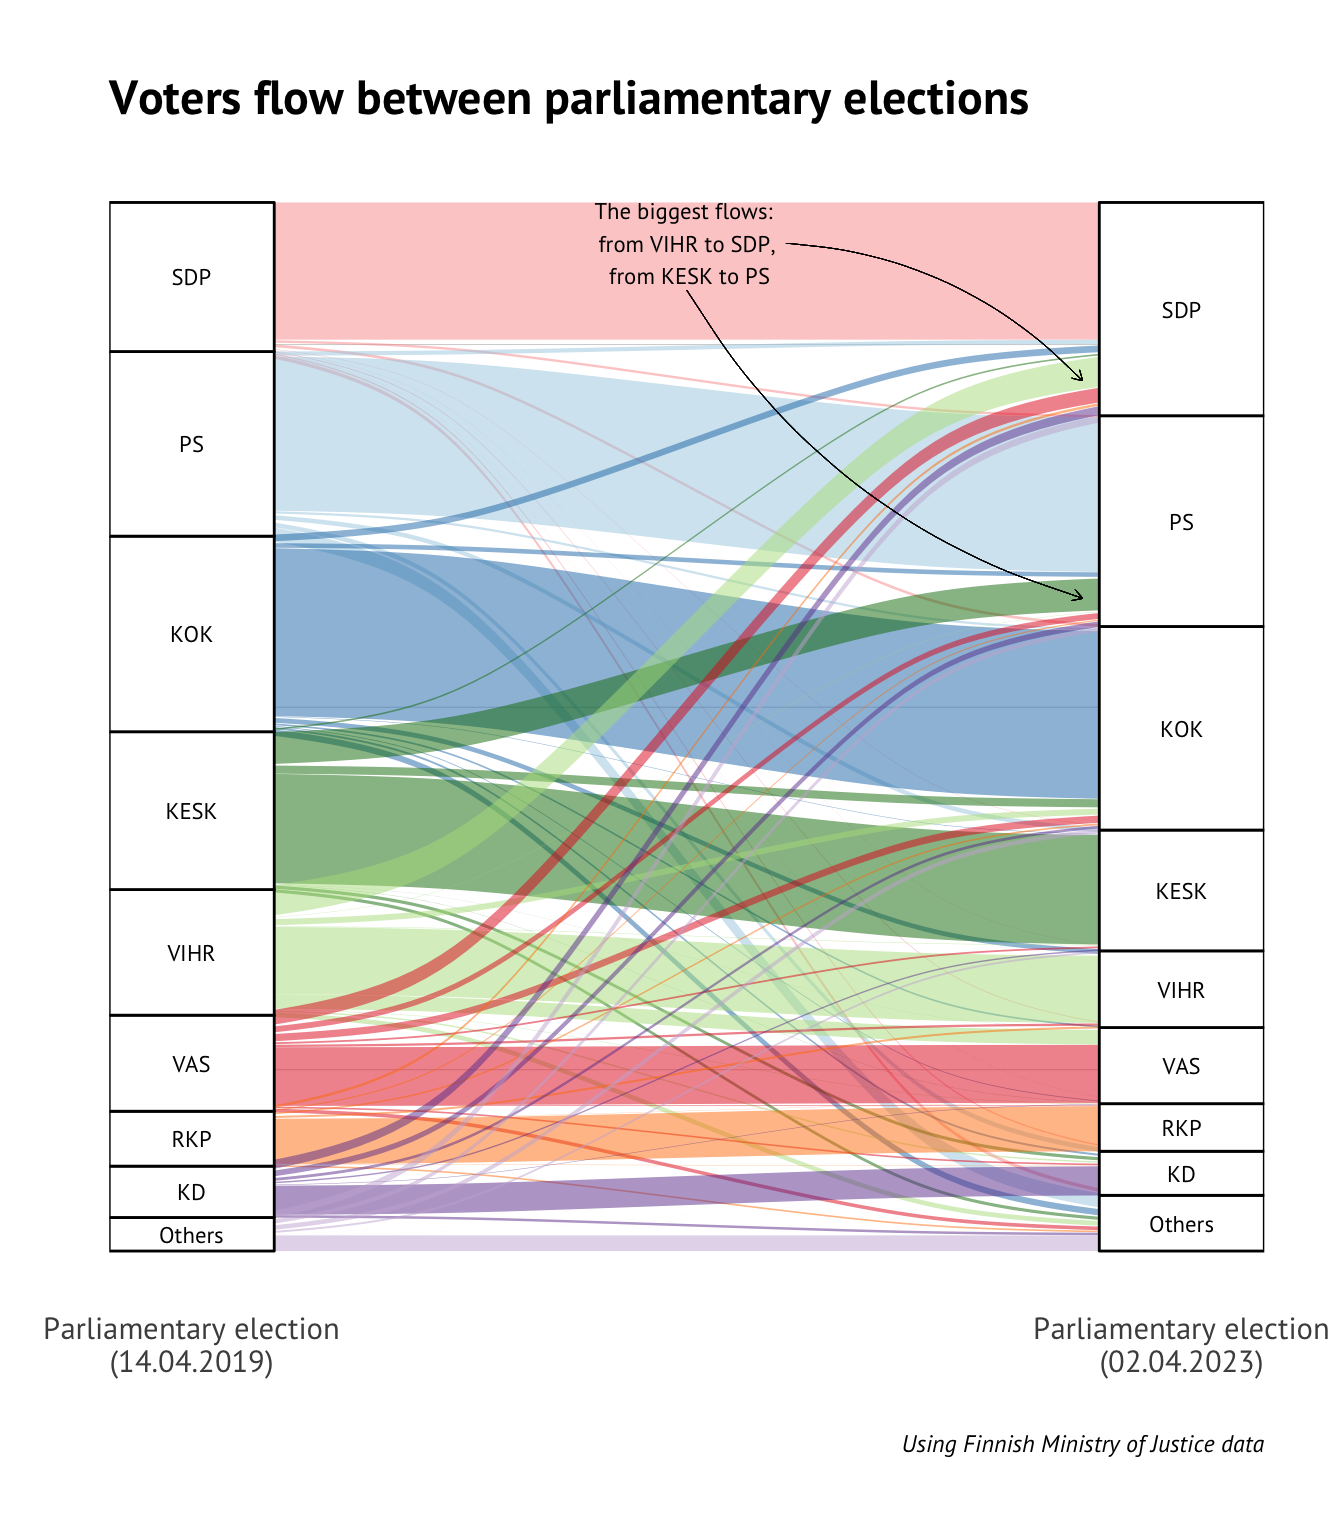
The analysis reveals crucial insights into the voter flows that proved decisive in these elections:
- 87,926 Keskusta voters shifted to Perussuomalaiset.
- 83,190 Vihreät voters moved to SDP.
- 40,627 Vasemmistoliitto voters switched to SDP.
- 40,148 Vihreät voters transferred to Vasemmistoliitto.
Unexplained part
The readers may be surprised why there are no significant insights about Kokoomus success in the analysis above. Partially the reason is in the error of analysis, in other words, the analysis explains not 100% of the votes. For different parties, these numbers are different, and for Kokoomus, it is the biggest, about 13% of votes our model cannot explain, which is significant for Finland, where the distances between parties’ support are tight. The keys to Kokoomus success probably are bigger votes activity of their supporters, and they did not lose support of their 2019’s voters.
Explained by nnls model votes in total: 93.5%
So, the keys to Kokoomus’ success are likely:
- Increased voter activity among their supporters.
- They did not lose the support of their 2019 voters.
Regional details
Electoral district-level results make more sense in Finland because of the specific electoral system. Every district has a quota of deputies to elect. So, if a party wants to get more representatives in parliament, they need to show a good result in every region. On the other hand, it is better to win the election in some regions and show terrible results in others than show moderate (but not winning) results in all regions. This situation results in tactical voting. The same people in different regions can vote differently depending on the local popularity of parties and candidates and the want of voters to save “the vote.” For the analysis, it means that voter flows in different regions can look differently.
The data reveals that Perussuomalaiset gained votes in the Uusimaa and Oulu regions between the 2019 and 2023 parliamentary elections, while Keskusta lost votes in those regions. Additionally, SDP gained votes in Uusimaa and Helsinki, while Vihreät lost votes in those regions. Furthermore, the data illustrates significant vote shifts between parties in the Uusimaa region, with the Others category gaining votes for Perussuomalaiset and SDP losing votes to Vasemmistoliitto and Kristillisdemokraatit. Overall, the data suggests that there were significant changes in voter preferences between the two elections, with some parties gaining and others losing support in different regions.
Conclusion
In conclusion, this article used the non-negative least squares method to explore voter flows between two parliamentary elections in Finland, providing valuable insights into the shifts in voter preferences over time. The analysis revealed that some parties gained support while others lost in different regions, highlighting the importance of understanding regional voting patterns. However, the analysis also indicated that there were unexplained factors that influenced voters’ choices. Nonetheless, this analysis demonstrates that it is possible to estimate voter flows without using sociological data, which can provide valuable insights for understanding changes in voter preferences over time.
Citation
BibTeX citation:
@online{kyrychenko2023,
  author = {Kyrychenko, Roman},
  title = {Voter {Flows} {Between} {Two} {Parliamentary} {Elections} in
    {Finland}},
  date = {2023-04-08},
  url = {https://randomforest.run/posts/voter-flows-between-two-parliamentary-elections-in-finland/voters_flows_in_finland.html},
  langid = {en}
}
For attribution, please cite this work as:
Kyrychenko, Roman. 2023. “Voter Flows Between Two Parliamentary
Elections in Finland.” April 8, 2023. https://randomforest.run/posts/voter-flows-between-two-parliamentary-elections-in-finland/voters_flows_in_finland.html.